#47Live ↗Directories & Data

AllTheAgencies.com: The Map of the Agency Economy

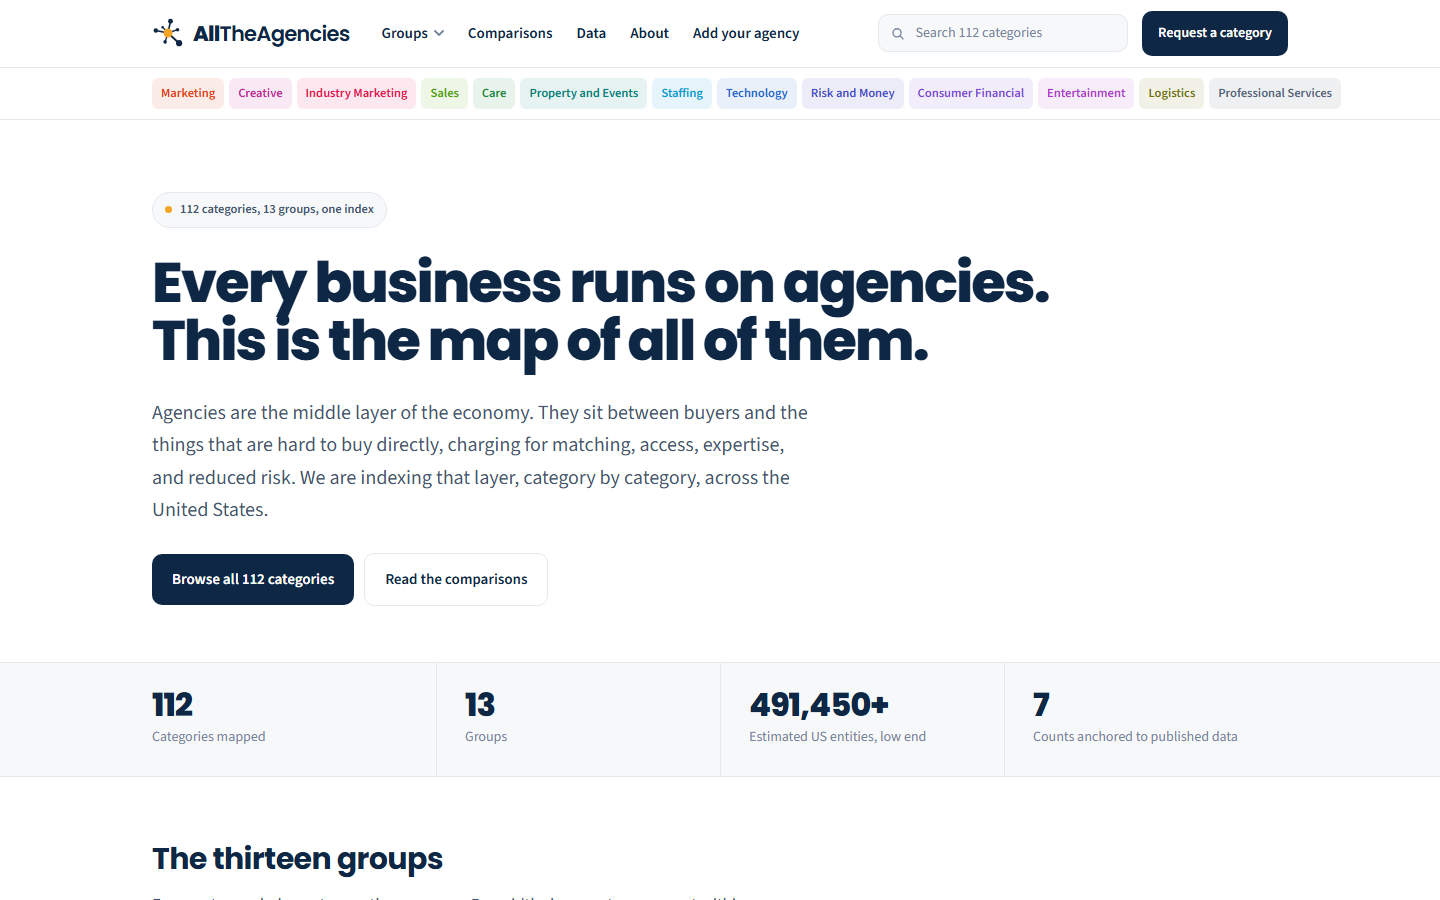
Every business runs on agencies, and this is the map of all of them: 112 agency categories across 13 groups, each with a real explainer covering what the category does, what it costs to engage, and how to choose one.

Visit it live ↗
AllTheAgencies.com: The Map of the Agency Economy screenshot
112 agency categories mapped · 13 groups · 491,450+ estimated US entities
⚡ Index the middle layer of the economy

The problem

Agencies are the middle layer of the economy, sitting between buyers and everything hard to buy directly, but nobody had indexed that layer category by category.

What Claude Code did

Claude built the index from a single taxonomy CSV that acts as the source of truth: 112 categories, each with a generated explainer page, comparison content between neighboring categories, and grounded entity estimates. A quality gate checks every page before deploy, and demand-signal capture watches which categories visitors actually care about.

The result

A complete first layer of the agency map is live. The demand signals now decide which categories earn a deeper second tier, so growth follows real interest instead of guesses.

Under the hood

ClaudeTaxonomy CSV pipelineNode.jsQC gate before deploy

FAQ

Where do the category pages come from?

A single taxonomy CSV drives everything. Each row becomes a category with a researched explainer, and the CSV staying canonical means the site can regenerate cleanly.

What decides what gets built next?

Visitors do. The site captures which categories draw interest, and those demand signals pick which ones get the deeper treatment.

Ask Joe about this project

Want to build things like this?Apply to the Claude Masterclass →